
Beating with Python: Building an AI App to Analyze Heart Health
Introduction:
Artificial Intelligence is rapidly transforming every field, and healthcare is no exception. Where it might take humans hours to interpret complex ECG (electrocardiogram) data, often with inconsistencies, AI can analyze patterns in seconds with impressive accuracy.
In this blog, we’ll use Python and CSV data to build a simple deep learning model that detects heart irregularities from ECG signals. The goal is to keep it accurate, practical, and easy to follow. While we start with CSV input, the system can be extended for real-time data from ECG sensors in the future.
We rely on the following third-party Python libraries:
- 1. Wfdb : Access and analyze physiological signals like ECG from PhysioNet.
- 2. Numpy : Fast numerical operations with arrays and matrices.
- 3. Pandas : Data analysis and manipulation using DataFrames.
- 4. Tensorflow : Deep learning framework for building AI models.
- 5. Opencv-python: Image and video processing for computer vision.
- 6. Scikit-learn : Machine learning tools for data modeling and prediction.
- 7. Tkinter : Common GUI library used for python.
1. Understand the Core Features
Before jumping into the code, it’s important to define what your AI-driven heart health app should do. Here’s a quick overview:
- Data Preprocessing: Load and clean ECG data (e.g., MIT-BIH) using wfdb, numpy, and pandas.
- Signal Visualization: Plot ECG signals with matplotlib to understand heartbeat patterns.
- Model Training: Build a CNN using TensorFlow and scikit-learn to classify ECGs.
- Analysis Mode: Support both single and batch ECG analysis.
- Optional UI: Use tkinter to let users upload ECG files and view results.
- Performance Check: Evaluate with accuracy, precision, recall, and confusion matrix.
- Future Ready: Code is structured to support live data and real-time deployment later.
2. Flow
The diagram shows the app flow from loading the UI, preparing data, checking/training the model, and finally rendering the interface. For now, we are focusing solely on understanding how the data is prepared and how to analyze it. Image processing is excluded, and all input data will be provided through a CSV file.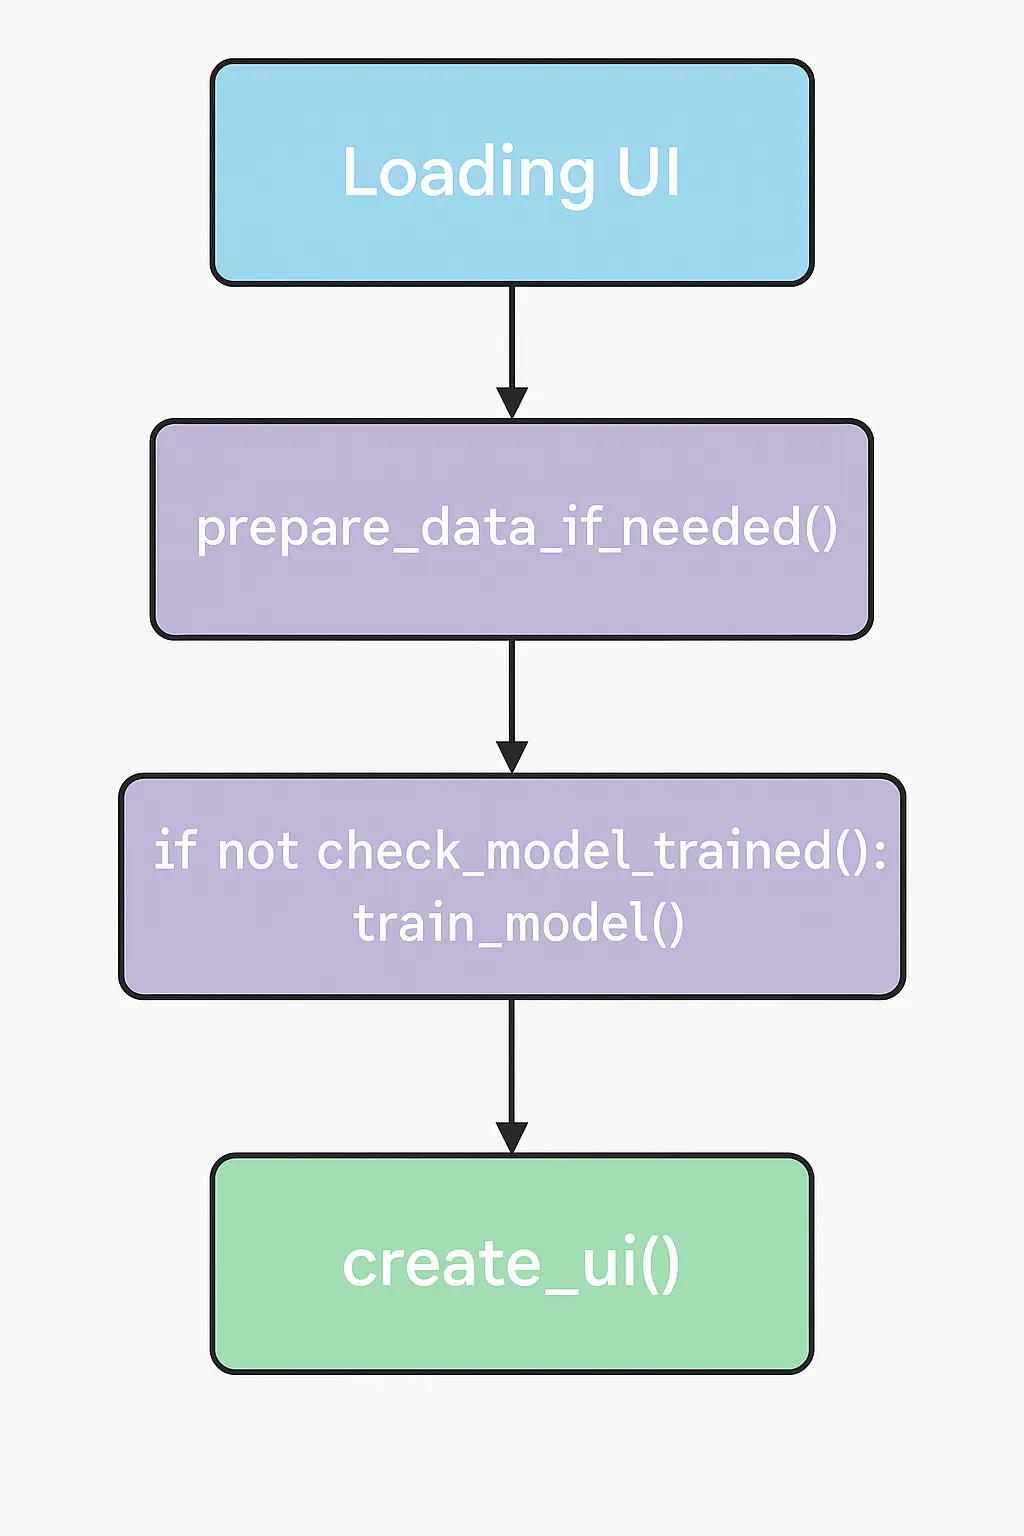
3.Understand Data Preparation
We convert raw ECG signals from the MIT-BIH dataset into fixed-size (250-sample) labeled windows. Each is tagged as normal or abnormal and saved as .npy files for efficient model training.
a. Key Function: extract_windows()
def extract_windows(record_id, window_size=250):
record = wfdb.rdrecord(record_id, pn_dir=”mitdb”)
annotation = wfdb.rdann(record_id, “atr”, pn_dir=”mitdb”)
signal = record.p_signal[:, 0]
- Loads the ECG waveform (p_signal) and annotations (heartbeat types) for a given record from PhysioNet’s MITDB dataset. We focus on lead 0 (the first signal channel).
- We focus on lead 0 (the first signal channel).
for i in range(len(annotation.sample)):
idx = annotation.sample[i]
label = annotation.symbol[i]
- Iterates over each heartbeat annotation.
- For each one, we extract a 250-sample window centered around the heartbeat (idx).
- We skip windows that would go out of bounds.
y_class = 0 if label == 'N' else 1
We assign the label:
- 0 for normal ('N')
- 1 for any abnormal heartbeat
The function returns two arrays:
- X: windows of ECG signals
- Y: corresponding binary labels
b. Data Aggregation and Saving
records = ['100', '101', '102']
X_all, y_all = [], []
for rec in records:
X, y = extract_windows(rec)
X_all.append(X)
y_all.append(y)
- Extracts labeled windows from multiple ECG records and aggregates them into two large arrays.
X_all = np.concatenate(X_all).reshape(-1, 250, 1)
y_all = to_categorical(np.concatenate(y_all), 2)
- Reshapes X_all into the 3D shape required by a 1D CNN: (samples, time_steps, channels)
- Converts labels to one-hot encoding for binary classification.
os.makedirs("data", exist_ok=True)
np.save("data/X_train.npy", X_all)
np.save("data/y_train.npy", y_all)
4. Making Predictions from ECG Data
Once our model is trained, the next step is to use it to predict whether a given ECG signal is normal or abnormal. The prediction system supports both CSV input and ECG images (which it first converts to CSV format).
a. Predicting from CSV
At this stage, we have excluded the image processing functionality. The model will receive input data directly from a CSV file.
def predict_from_csv(file_path):
data = np.loadtxt(file_path, delimiter=',')
- Loads a single ECG waveform from a CSV file.
- Ensures the data is flattened to a 1D array (useful if saved in matrix format).
EXPECTED_LENGTH = 250
if len(data) < EXPECTED_LENGTH:
data = np.pad(data, (0, EXPECTED_LENGTH - len(data)), mode='constant')
elif len(data) > EXPECTED_LENGTH:
data = data[:EXPECTED_LENGTH]
- Pads or trims the signal to the expected length (250 samples), ensuring consistent input shape for the model.
data = data.reshape(1, EXPECTED_LENGTH, 1)
- Reshape it to match the input shape required by the CNN:(batch_size, time_steps, channels) = (1, 250, 1).
model = load_trained_model()
raw_predictions = make_prediction(model, data)
labels = get_class_labels(raw_predictions)
- Feeds the data into the model.
- Converts the raw output probabilities into readable class labels (Normal, Abnormal).
Conclusion
This AI-based ECG analysis app shows how deep learning can interpret heartbeat signals with strong potential. We've built a working model from data prep to prediction. In the future, it can be expanded for real-time monitoring using sensors, with cloud and mobile support for smarter, accessible heart health tracking.
GitHub Repository
You can find the full source code and ongoing updates here: